This is archived information for Stat 445 Sect 201 (Spring, 2005).
Project #2 Marking Results
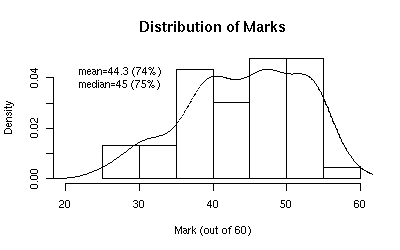
For the most part (and not surprisingly), students did better on Midterm Project #2 than on the first project. The median was up from 66% on the first project to 75% on this project. In general, report structure and style were much improved, and I was impressed by some very clever analysis of some difficult data.
Distribution of Marks
The distribution of marks was as follows:
The distributions of the individual mark components (and their correlations with the total mark) are given by the following set of boxplots. Note that, in a change from my marking for Project #1, I decided to combine exploratory and confirmatory analysis into a single analysis component.
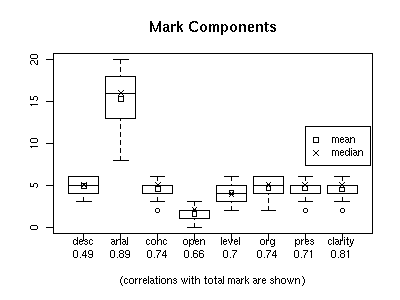
The components and their maximum possible values were:
| desc (6) | description of data and problem |
|---|---|
| anal (21) | statistical analysis |
| conc (6) | conclusions |
| open (3) | open issues and limitations |
| level (6) | level appropriate to audience |
| org (6) | organization and structure |
| pres (6) | presentation of analysis |
| clarity (6) | clarity |
The component meanings are described in more detail on the Marking Guidelines webpage.
This is archived information for Stat 445 Sect 201 (Spring, 2005).