This is archived information for Stat 445 Sect 201 (Spring, 2005).
Project #1 Marking Results
I was quite impressed with the quality of reports. Almost all students had obviously put in a lot of work, and even when the final grade was low, it was not for lack of effort but rather because a student had misunderstood the assignment (usually handing in a lab-like assignment with R code and unedited R output but almost no explanatory text).
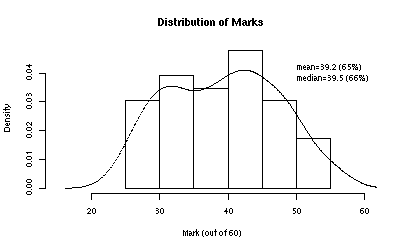
Distribution of Marks
The distribution of marks was as follows:
The distributions of the individual mark components (and their correlations with the total mark) are given by the following set of boxplots.
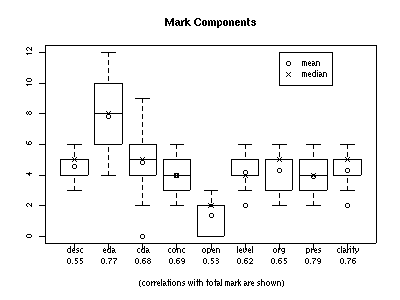
The components and their maximum possible values were:
| desc (6) | description of data and problem |
|---|---|
| eda (12) | exploratory data analysis |
| cda (9) | confirmatory analysis |
| conc (6) | conclusions |
| open (3) | open issues and limitations |
| level (6) | level appropriate to audience |
| org (6) | organization and structure |
| pres (6) | presentation of analysis |
| clarity (6) | clarity |
The component meanings are described in more detail on the Marking Guidelines webpage.
Since the total mark is the sum of the components, we would expect a positive correlation between total mark and each component. Because "eda" and "cda" are the largest valued components, we might expect them to have larger correlations than the others, but in fact, the top three correlated components are "pres" (0.79), "eda" (0.77), and "clarity" (0.76).
Fitting the model total ~ pres gives the following fit:
fitted total mark = 19.9 + 4.97 pres
with R2=0.62 and a residual std err of 5.0. Using the R function add1(...), we can see which additional component adds the most explanatory power when added to the model. It turns out that the model total ~ pres + clarity with the following fit:
fitted total mark = 11.1 + 3.57 pres + 3.32 clarity
with R2=0.84 and an RSE=3.3 is the best two-component model. The correlation between "pres" and "clarity" is only 0.43, and including the interaction term in the model (i.e., fitting total ~ pres*clarity) doesn't result in a significantly better model (F test gives p=0.42).
Therefore, it seems that good performance on the whole project can be predicted well by good performance on two relatively independent aspects: the presentation of analysis and its clarity (by which I mean the logical flow from problem to analysis to conclusion).
Top-Scoring Projects
Note: Sorry for the earlier technical difficulties. The sample projects are now available again.
Here are the 6 projects that received the highest marks. (All authors wished to remain anonymous, presumably so fellow group members wouldn't make them do all the hard work for the final project.)
Sample #1 (9 pages, but double-spaced with big plots) as a PDF file: I was most impressed by the clarity of this project. It was always clear to me what the author was trying to do and how he or she was proceeding, and the exploratory data analysis seemed to proceed naturally in a way that suggested the appropriate detailed analysis.
The background information on page 2 was a nice touch: it showed the author had taken the time to do a bit of research on the problem. (True, it had mostly been copied verbatim from the reference given at the bottom, and I wish this fact had been made clearer—or better yet, that the information had been customized to the project.) More importantly, throughout the paper, the author proceeded in a manner that made sense in the context of this background information.
I'm not sure that the "stars" display in question #4 worked very well. It would have been much more effective if the author had tried to group similar shapes together in the plot.
Overall, though, an extremely strong project.
Sample #2 (8 pages, single-spaced) as a PDF file: This was another extremely clear project and one that was particularly well organized with a strong concluding section.
There was one statistical misfire: fitting rating linearly to a numeric shelf variable instead of a shelf factor misses the fact that shelf 2 has significantly lower-rated cereals than the other two shelves. Also, the boxplots in the last row of Diagram 1 may be misleading because the levels on the x-axis aren't equally spaced (e.g., protein has levels 1, 2, 3, 4, and 6, but 5 is missing).
Also, Table 1 had lots of excess precision, and the unedited R output on page 5 was a no-no, but if you "wow" me with such a nicely organized report, you can get away with those sorts of things, too!
Sample #3 (8 pages, single-spaced) as a PDF file: This project probably had the most extensive statistical analysis (both exploratory and confirmatory) of any project. Pretty much every suggestion of a relationship was followed up by an appropriate model or statistical test.
I wish there'd been a concluding section because the report seemed to end very abruptly, but at least the conclusions were made clear in the executive summary, and overall the report was very well organized. Also, the author made a particular effort to give common-sense interpretations of his or her results.
Sample #4 (7 pages, double-spaced) as a PDF file: Once again, strong organization and clarity were the big factors here. Tables and graphs were neat, relevant, and referenced in the text, though some plots were a little cramped. However, one thing that deserves special mention are the tables (like Table 2) that present several related models, with their coefficients and significance levels, in a nice concise form for comparison. More importantly, the relevance of the comparisons was explained clearly in the accompanying text.
Sample #5 (7 pages, double-spaced) as a PDF file: This report featured a very strong executive summary (though, still it probably should have come before even the one-paragraph "Introduction"), excellent organization, and a great concluding section.
Figures 2 and 3 were pretty displays, though I wish a little more had been said about differences between manufacturers. Figures 4 to 6 do a great job summing up some interesting differences by manufacturer, and I only wish they'd been followed up with a supporting model or statistical test.
Sample #6 (7.5 pages, double-spaced) as a PDF file: This report featured the nicest graphical display of any project in Figure B. I didn't ask, but I assume the author started with the sample code given in the "Examples" section of the documentation for the pairs(...) function. The great thing about this display (which is basically a scatterplot matrix with univariate histograms down the diagonal and the redundant upper-half of the matrix replaced with correlation coefficients) is that it, with a few lines of explanatory text, compactly presents information that took other authors two or more pages of plots, text, and tables.
One statistical flaw was that I don't think the final model (which combined nutritional information and a manufacturer factor) makes much conceptual sense. However, I think the author interpreted the rating as coming from a survey of customers rather than from the editors of Consumer Reports magazine, and in that context the model might be a good one (reflecting concern with nutrition combined with prejudices and biases about different manufacturers that real consumers might have).
A note on report length: I believe I said the projects should be around 6 pages, single-spaced with an 8 page maximum limit. Now, these top-scoring projects were generally closer to 8 pages than 6, but text was typically double-spaced (or maybe 1.5-spaced) and figures were sometimes big. Also, just about everyone wrote an 8 page report, and lots of long projects got comparatively low grades, so I still maintain that a 6 page report had as good a chance of getting the highest mark as an 8 page report.
This is archived information for Stat 445 Sect 201 (Spring, 2005).